


Reiser, Ferie & Fritid
Reiser, Ferie & Fritid
Reiser, Ferie & Fritid
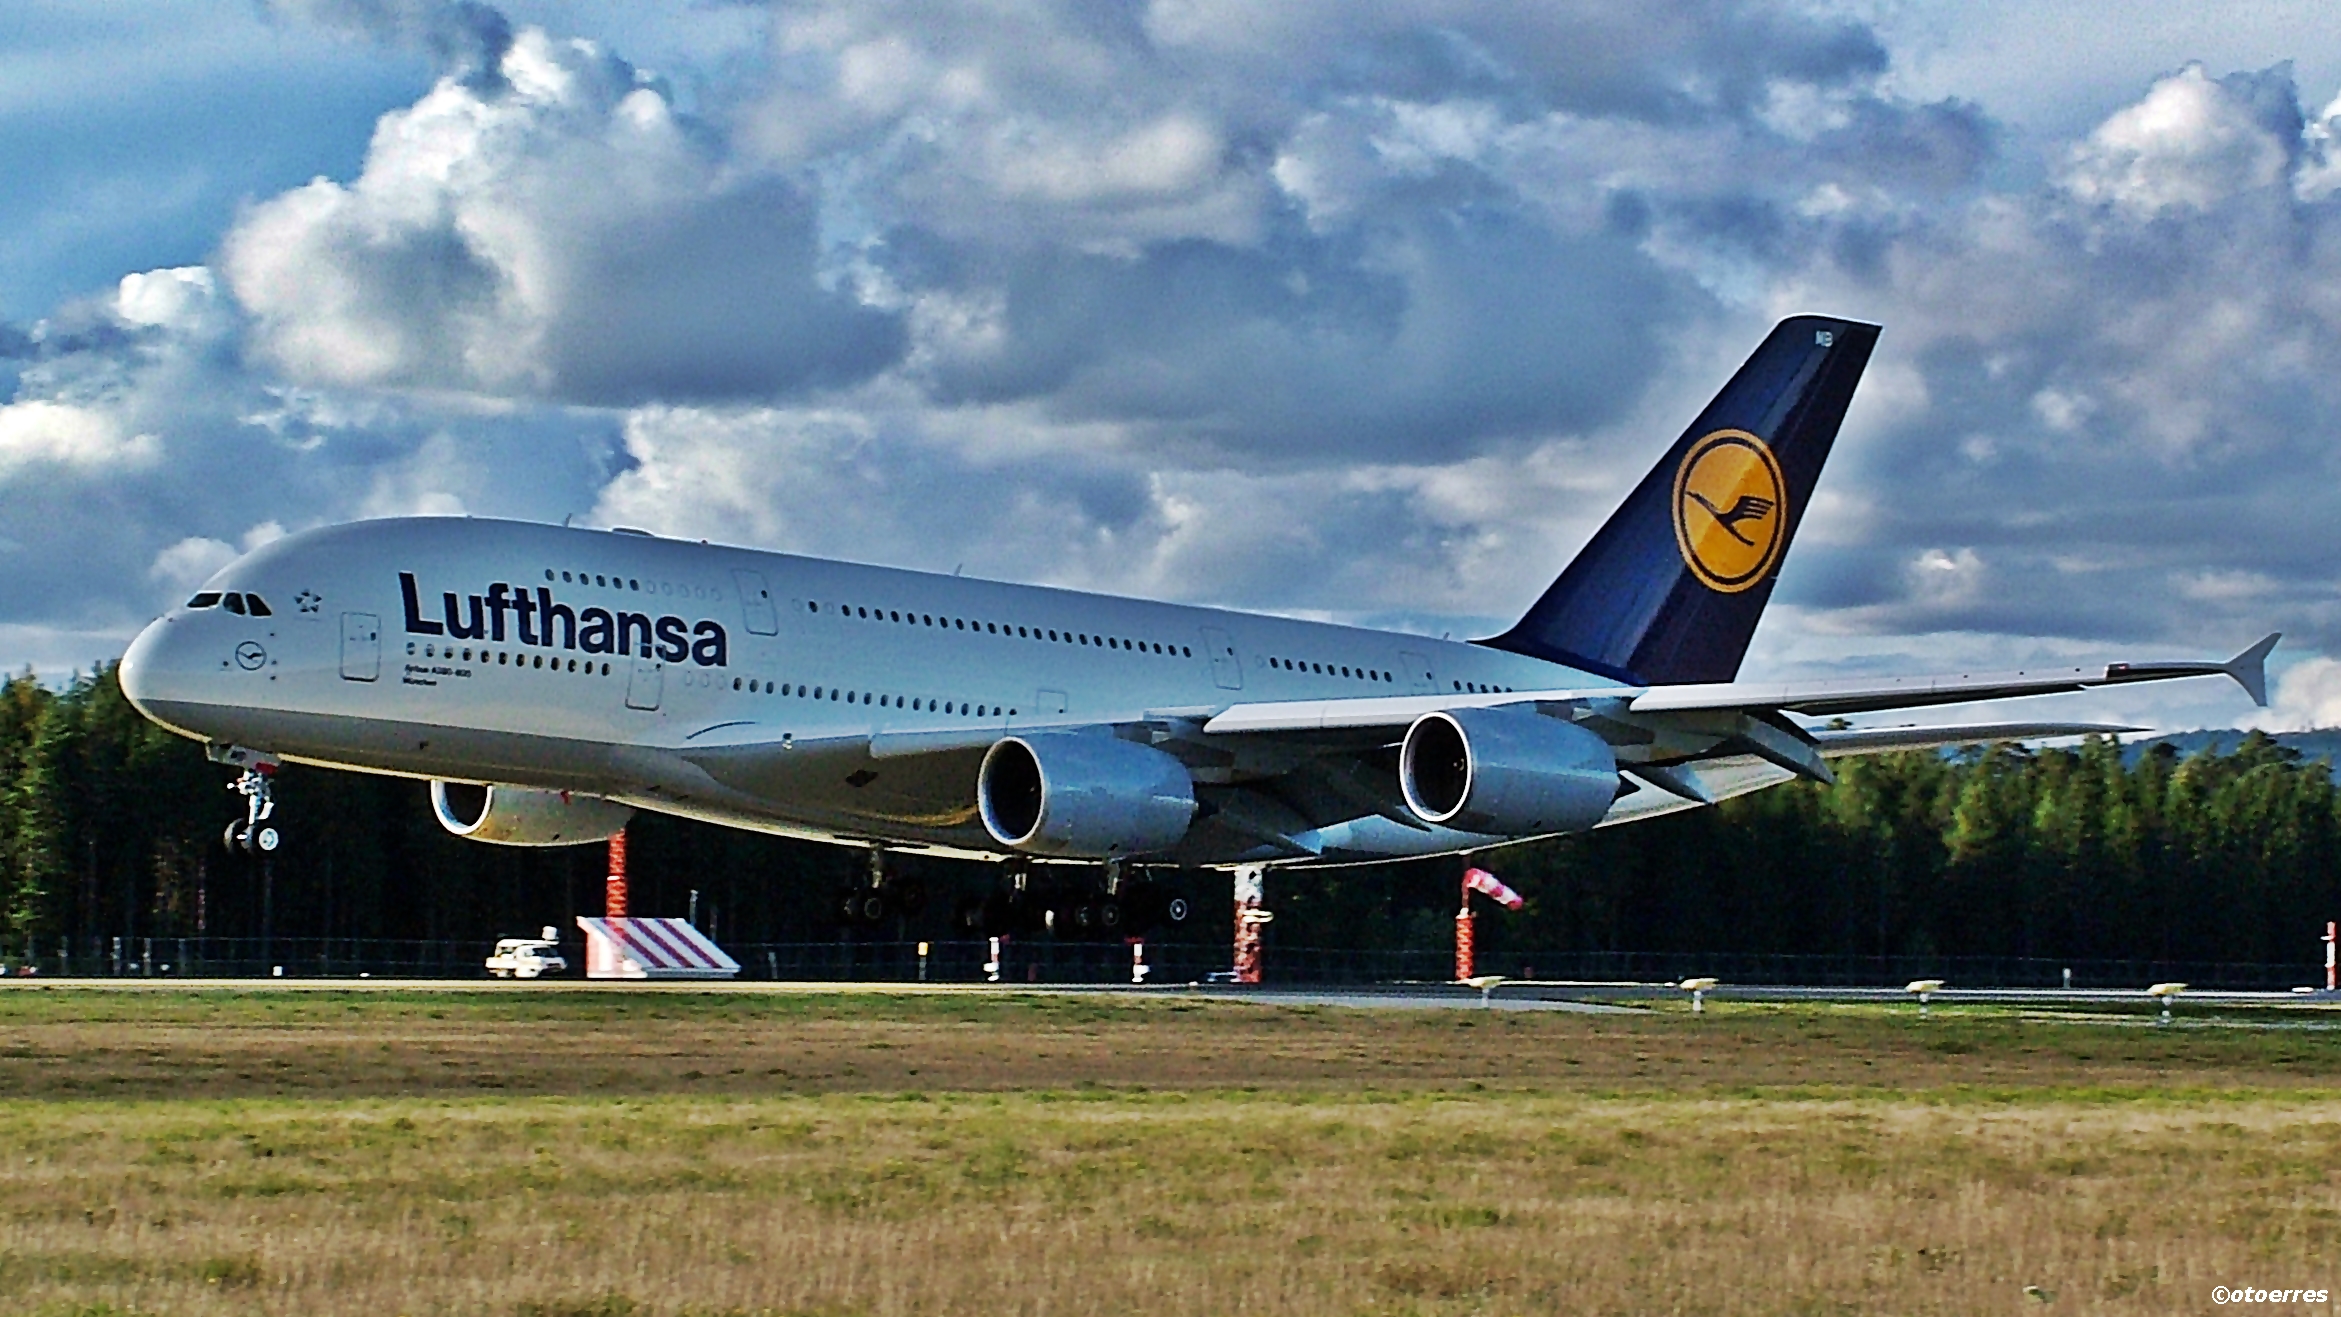
Lufthansa Group welcomes almost 10 million passengers on board in March 2017
The airlines of the Lufthansa Group transported some 9.6 million passengers in March, 14% more than the same period last year, although the popular Easter travel time started at the beginning of  April. In the first quarter, 25.2 million passengers, travelled with the Lufthansa Group, amounting to 13% more than the previous year.
Total capacity for the month was up to 9.9% in available seat-kilometer terms and total traffic volume, measured in revenue passenger-kilometers, increased by 11%. The seat load factor improved accordingly, rising 0.8 percentage points to 77.2%, compared to March 2016. For the first quarter, both the available seat-kilometers increased to 9.5% and the traffic volume to 11.3%. This results in having an increase in the seat load factor up to 76.7% and thus, a rise of 1.2 percentage points, compared to the previous year. Pricing was slightly positive in March on a currency-neutral basis.
Cargo capacity increased 6.7% year-on-year, while cargo sales were up 13.3% in revenue tonne-kilometer terms. As a result, the Cargo load factor showed a corresponding improvement, rising 4.3 percentage points for the month. Total capacity in the first quarter was up to 3.6% and cargo sales were up to 8.3% and the cargo load factor increased 3.0 percentage points, compared to 2016.
Hub airlines
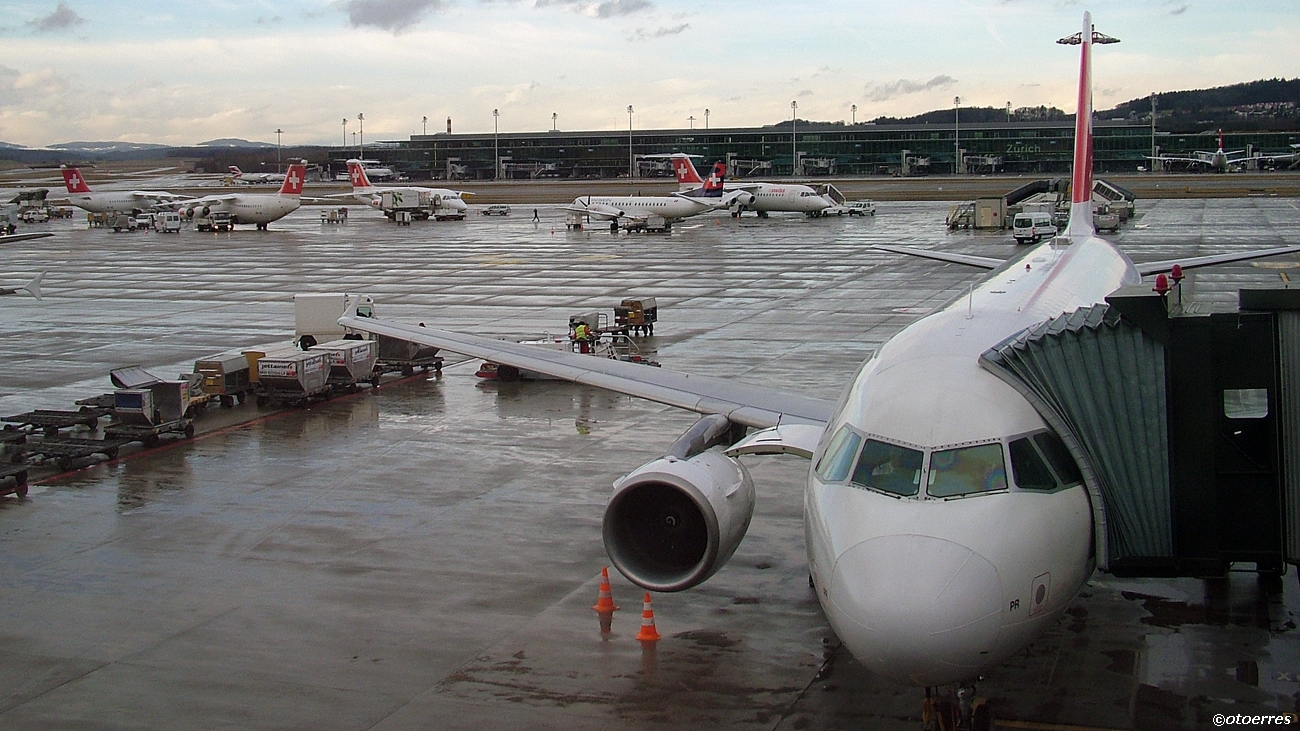
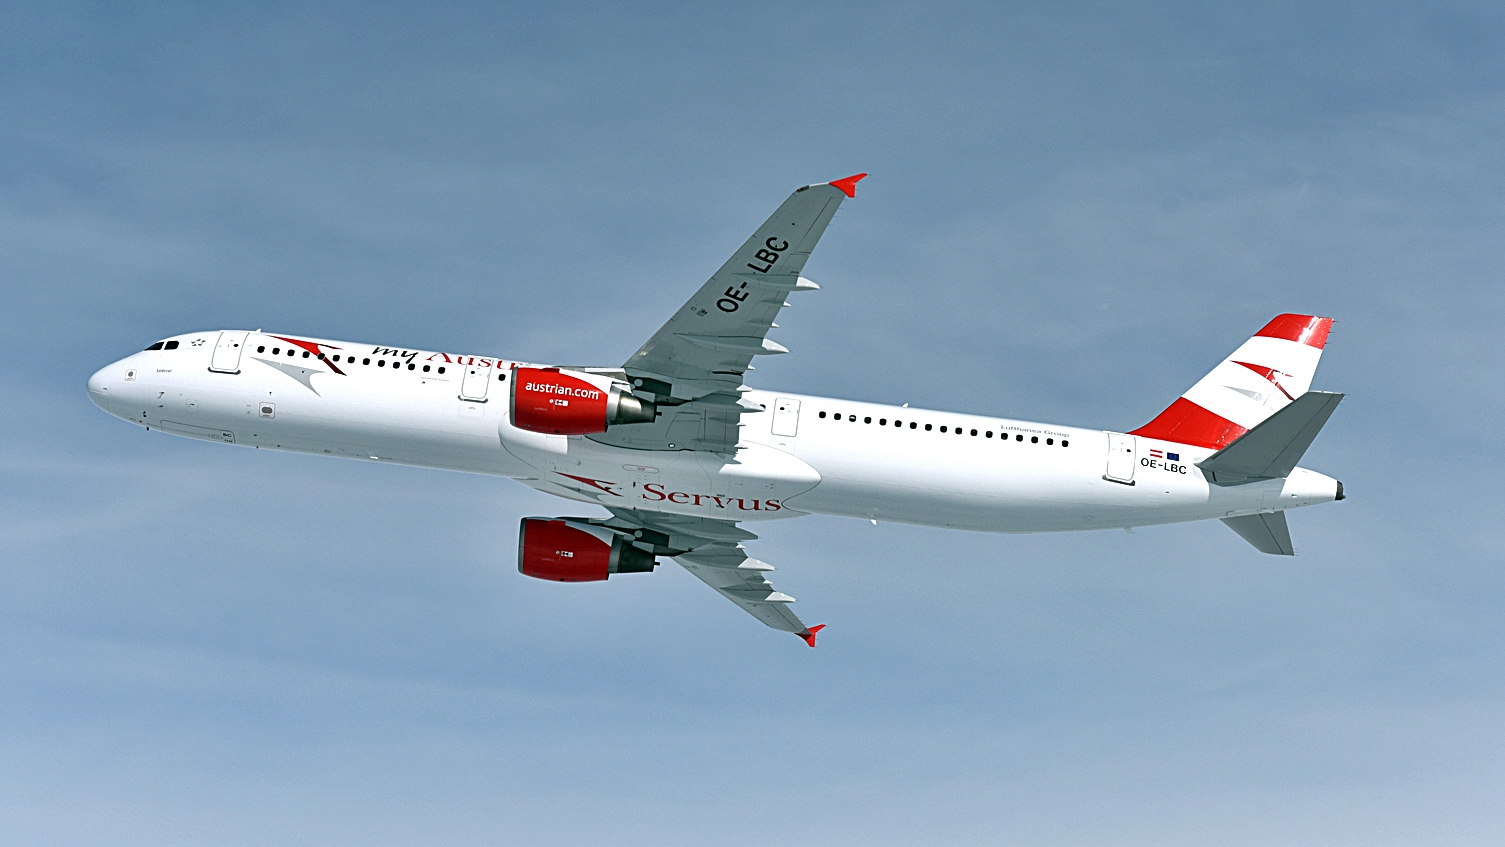
Network airlines Lufthansa, Swiss and Austrian Airlines carried 7.4 million passengers in March, 4.5% more than in the prior-year period. A total of 19.7 million passengers flew with network airlines in the first quarter, equaling 3.5 more percentage points than the previous year. . Capacity increased by 1.5%, while the sales volume was up 2.9%, raising seat load factor by 1.0 percentage points. During the first quarter, the capacity increased  1.2% and the sales volume 3.3%, resulting in a 76.5% seat load factor, and increase of  1.5 percentage points.
(austrian)
Lufthansa German Airlines transported 5.2 million passengers in March, a 4.1% increase, compared to the same month last year. 13.7 million passengers flew with Lufthansa German Airlines, thus, 2.8% more than the first quarter last year. March capacity was reduced by a slight 0.1%, while the sales volume was up 2.1%. Furthermore, the seat load factor was up to 78.2%, therefore 1.8 percentage points above the prior-year level. In the first quarter, seat load factor rose 2.0 percentage points, compared to the prior-year period. The capacity decreased 0.8%, while the sales volume was up 1.9%.
Point-to-point airlines
The Lufthansa Group’s point-to-point airlines — Eurowings (including Germanwings) and Brussels Airlines — carried 2.2 million passengers in March. Among this total, 2.0 million passengers were on short-haul flights and 0.2 million flew long-haul. This amounts to an increase of 66.0%, in comparison to the previous year, which alongside organic growth is a result of the inclusion of Brussels Airlines and additional capacity through the wet lease agreement with Air Berlin. In total, 5.5 million passengers were transported in the first quarter. Of these, 5.0 million were on short-haul and 0.6 million on long-haul flights.
March capacity was 113% above its prior-year level, while February sales volume was up 109%. The seat load decreased by 1.5 percentage points. The entire first quarter capacity increased  to 112.5% and the sales volume 112.4%. The seat load factor decreased to 0.1 percentage-points compared to the first quarter in the previous year.
On short-haul services the point-to-point carriers raised capacity 68.3% and increased sales volume by 64.6%, resulting in a 1.6 percentage points decrease in seat load factor, compared to March 2016. Considering the first quarter, both the capacity and sales volume increased to 68.3% and 69.1%, respectively, resulting in an improved seat load factor by 0.3 percentage points. The seat load factor for the long-haul services decreased 9.8 percentage points, following a 282.7% increase in capacity and a 242.3% rise in sales volume, compared to the previous year. In terms of long-haul services in the first quarter, the total capacity was up to 259% in available seat-kilometer terms and the sales volume was 215.9%, resulting in a11.3 percentage points decrease in seat load factor.
| Lufthansa Group | |||||
|---|---|---|---|---|---|
| Month | yoy | Cumulative | yoy | ||
| Total Lufthansa Group Airlines | Passengers in 1,000 | 9,590 | +14.0% | 25,233 | +13.0% |
| Available seat-kilometers (m) | 24,942 | +9.9% | 68,756 | +9.5% | |
| Revenue seat-kilometers (m) | 19,253 | +11.0% | 52,346 | +11.3% | |
| Passenger load-factor (%) | 77.2 | +0.8pts. | 76.1 | +1.2pts. | |
| Available Cargo tonne-kilometers (m) | 1,329 | +6.7% | 3,558 | +3.6% | |
| Revenue Cargo tonne-kilometers (m) | 980 | +13.3% | 2,499 | +8.3% | |
| Cargo load-factor (%) | 73.8 | +4.3pts. | 70.2 | +3.0pts. | |
| Number of flights | 89,538 | +8.5% | 246,283 | +6.0% | |
| Lufthansa German Airlines | Passengers in 1,000 | 5,167 | +4.1% | 13,711 | +2.8% |
| Available seat-kilometers (m) | 15,087 | -0.1% | 41,237 | -0.8% | |
| Revenue seat-kilometers (m) | 11,795 | +2.1% | 31,842 | +1.9% | |
| Passenger load-factor (%) | 78.2 | +1.8pts. | 77.2 | +2.0pts. | |
| Number of flights | 44,857 | -0.1% | 123,579 | -3.0% | |
| SWISS | Passengers in 1,000 | 1,437 | +5.4% | 3,928 | +6.3% |
| Available seat-kilometers (m) | 4,339 | +6.9% | 12,594 | +8.0% | |
| Revenue seat-kilometers (m) | 3,384 | +7.8% | 9,749 | +10.2% | |
| Passenger load-factor (%) | 78.0 | +0.7pts. | 77.4 | +1.6pts. | |
| Number of flights | 12,929 | -4.7% | 37,560 | -3.5% | |
| Austrian Airlines | Passengers in 1,000 | 883 | +7.9% | 2,189 | +6.6% |
| Available seat-kilometers (m) | 1,902 | +4.0% | 5,087 | +3.3% | |
| Revenue seat-kilometers (m) | 1,316 | -1.6% | 3,486 | -0.5% | |
| Passenger load-factor (%) | 69.2 | -3.9pts. | 68.5 | -2.6pts. | |
| Number of flights | 11,318 | +5.3% | 29,808 | +3.1% | |
| Total Network Airlines* |
Passengers in 1,000 | 7,435 | +4.5% | 19,684 | +3.5% |
| Available seat-kilometers (m) | 21,296 | +1.5% | 58,831 | +1.2% | |
| Revenue seat-kilometers (m) | 16,470 | +2.9% | 45,009 | +3.3% | |
| Passenger load-factor (%) | 77.3 | +1.0pts. | 76.5 | +1.5pts. | |
| Number of flights | 68,380 | -0.4% | 188,889 | -2.6% | |
| * Lufthansa German Airlines incl. regional airlines, SWISS incl. Edelweiss Air, Austrian Airlines | |||||
| Total Point-to-Point Airlines* |
Passengers in 1,000 | 2,155 | +66.0% | 5,548 | +68.0% |
| Available seat-kilometers (m) | 3,646 | +113.0% | 9,925 | +112.5% | |
| Revenue seat-kilometers (m) | 2,783 | +109.0% | 7,337 | +112.4% | |
| Passenger load-factor (%) | 76.3 | -1.5pts. | 73.9 | -0.1pts. | |
| Number of flights | 20,288 | +55.3% | 55,169 | +51.8% | |
| * Incl. Eurowings and Brussels Airlines | |||||
| Additional references | |||||
| Pricing environment | Â Slightly positive (excl. currency) | ||||
| Comments | Shift of Easter holidays into April this year | ||||
| Next Investor Info | 10 May 2017 | ||||
| Â
Network Airlines & Cargo* |
|||||
| By region | Month | yoy | Cumulative | yoy | |
| Europe | Passengers in 1,000 | 5,689 | +4.9% | 14,903 | +3.6% |
| Available seat-kilometers (m) | 5,956 | +2.8% | 16,191 | +0.4% | |
| Revenue seat-kilometers (m) | 4,317 | +3.2% | 11,367 | +3.2% | |
| Passenger load-factor (%) | 72.5 | +0.3pts. | 70.2 | +1.9pts. | |
| Available Cargo tonne-kilometers (m) | 62 | -3.7% | 167 | -2.5% | |
| Revenue Cargo tonne-kilometers (m) | 34 | +1.6% | 88 | +0.3% | |
| Cargo load-factor (%) | 55.4 | +2.9pts. | 52.8 | +1.5pts. | |
| America (North und South) |
Passengers in 1,000 | 819 | +0.7% | 2,199 | +1.7% |
| Available seat-kilometers (m) | 7,928 | +0.7% | 21,951 | +2.3% | |
| Revenue seat-kilometers (m) | 6,231 | +0.8% | 16,885 | +2.0% | |
| Passenger load-factor (%) | 78.6 | +0.1pts. | 76.9 | -0.3pts. | |
| Available Cargo tonne-kilometers (m) | 593 | +7.2% | 1,589 | +2.9% | |
| Revenue Cargo tonne-kilometers (m) | 424 | +13.8% | 1,096 | +8.1% | |
| Cargo load-factor (%) | 71.6 | +4.1pts. | 69 | +3.3pts. | |
| Asia/Pacific | Passengers in 1,000 | 535 | +4.8% | 1,507 | +3.8% |
| Available seat-kilometers (m) | 5,275 | +0.5% | 14,543 | -0.2% | |
| Revenue seat-kilometers (m) | 4,280 | +4.8% | 12,066 | +4.4% | |
| Passenger load-factor (%) | 81.1 | +3.3pts. | 83.0 | +3.7pts. | |
| Available Cargo tonne-kilometers (m) | 549 | +8.7% | 1,433 | +6.1% | |
| Revenue Cargo tonne-kilometers (m) | 449 | +15.0% | 1,123 | +10.9% | |
| Cargo load-factor (%) | 81.9 | +4.5pts. | 78.4 | +3.4pts. | |
| Middle East/ Africa |
Passengers in 1,000 | 393 | +6.0% | 1,075 | +5.9% |
| Available seat-kilometers (m) | 2,137 | +3.8% | 6,146 | +3.2% | |
| Revenue seat-kilometers (m) | 1,641 | +5.2% | 4,691 | +5.9% | |
| Passenger load-factor (%) | 76.8 | +1.0pts. | 76.3 | +1.9pts. | |
| Available Cargo tonne-kilometers (m) | 125 | +1.4% | 370 | -0.2% | |
| Revenue Cargo tonne-kilometers (m) | 72 | +6.6% | 191 | -0.9% | |
| Cargo load-factor (%) | 57.5 | +2.8pts. | 51.8 | -0.3pts. | |
| * Lufthansa German Airlines incl. regional airlines, SWISS incl. Edelweiss Air, Austrian Airlines, Lufthansa Cargo | |||||
| Point-to-Point Airlines* | |||||
| Month | yoy | Cumulative | yoy | ||
| Short-haul | Passengers in 1,000 | 1,958 | +56.8% | 4,994 | +58.2% |
| Available seat-kilometers (m) | 2,282 | +68.3% | 6,040 | +68.3% | |
| Revenue seat-kilometers (m) | 1,645 | +64.6% | 4,118 | +69.1% | |
| Passenger load-factor (%) | 72.1 | -1.6pts. | 68.2 | +0.3pts. | |
| Long-haul | Passengers in 1,000 | 197 | +297.4% | 554 | +277.0% |
| Available seat-kilometers (m) | 1,364 | +282.7% | 3,885 | +259.0% | |
| Revenue seat-kilometers (m) | 1,137 | +242.3% | 3,220 | +215.9% | |
| Passenger load-factor (%) | 83.4 | -9.8pts. | 82.9 | -11.3pts. | |
| * Incl. Eurowings and Brussels Airlines | |||||