


Reiser, Ferie & Fritid
Reiser, Ferie & Fritid
Reiser, Ferie & Fritid
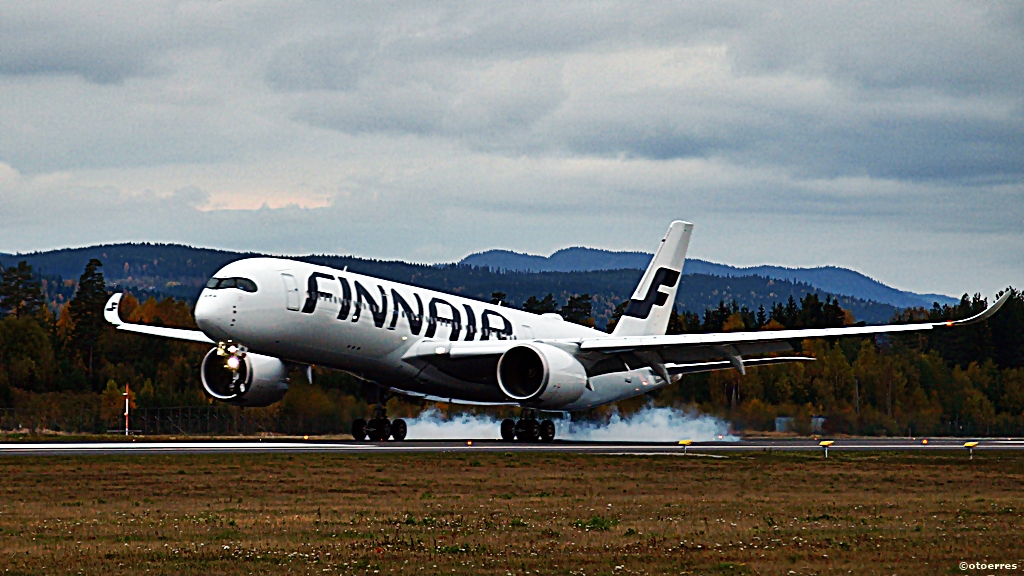
Finnair Traffic Performance in February 2016
In February, Finnair’s overall capacity measured in Available Passenger Kilometres grew by 8.4 per cent and traffic measured in Revenue Passenger Kilometres grew by 8.7 per cent yearâ€onâ€year. The leap year had a positive growth contribution of approximately 3 per cent, as there was one more day in February than in the comparison period. The passenger load factor rose by 0.2 % points to 79.1 per cent

The capacity in Asian traffic increased in February by 7.9 per cent, while traffic measured in Revenue Passenger Kilometres increased by 10.5 per cent yearâ€onâ€year. Meanwhile, capacity in American traffic increased by 5.3 per cent, but traffic growth as measured in RPK was only 2.2 per cent.
The capacity in European traffic grew by 7.9 per cent on the back of increased frequencies and new destinations, while traffic measured in Revenue Passenger Kilometres grew by 5.1 per cent yearâ€onâ€year. At the same time, the growth in domestic traffic is mainly attributed to the inclusion of the routes previously operated at Norra’s own commercial risk as Finnair’s purchased traffic.
In February, the cargo capacity in scheduled traffic measured in Available Tonne Kilometres grew by 11.4 per cent, and Revenue Tonne Kilometres increased by 6.3 per cent year on year. The cargo load factor in scheduled traffic was 52.5 per cent. In addition, Finnair’s total freight capacity includes two weekly freighter flights between Helsinki and Brussels and two weekly freighter flights shared with IAG between Helsinki and London, both operated by DHL.
In February, 81.6 per cent of all Finnair flights arrived on schedule (87.0).
Finnair Traffic Performance February 2016
| February2016 | %-Change | Year-to  date 2016 | %-Change | |
| Total Traffic | ||||
| Passengers  1000 | 814,8 | 13,2 | 1 595,3 | 11,3 |
| Available  seat kilometres mill | 2 599,9 | 8,4 | 5 331,8 | 6,3 |
| Revenue  passenger kilometres mill | 2 056,7 | 8,7 | 4 183,9 | 7,4 |
| Passenger  load factor % | 79,1 | 0,2 p | 78,5 | 0,8 p |
| Cargo  tonnes total | 10 549,7 | 7,8 | 21 291,9 | 11,3 |
| Available  tonne kilometres mill | 379,9 | 8,3 | 780,1 | 5,7 |
| Revenue  tonne-kilometres mill | 247,2 | 8,5 | 502,4 | 8,7 |
| Overall  load factor % | 65,1 | 0,1 p | 64,4 | 1,8 p |
| Europe | ||||
| Passengers  1000 | 441,8 | 9,3 | 876,5 | 7,4 |
| Available  seat kilometres mill | 962,5 | 7,9 | 1 947,9 | 6,5 |
| Revenue  passenger kilometres mill | 699,3 | 5,1 | 1 403,0 | 4,3 |
| Passenger  load factor % | 72,7 | -1,9 p | 72,0 | -1,5 p |
| North Atlantic | ||||
| Passengers  1000 | 21,2 | 1,1 | 43,7 | 1,2 |
| Available  seat kilometres mill | 204,8 | 5,3 | 413,3 | 1,8 |
| Revenue  passenger kilometres mill | 158,9 | 2,2 | 327,5 | 1,9 |
| Passenger  load factor % | 77,6 | -2,4 p | 79,2 | 0,1 p |
| Asia | ||||
| Passengers  1000 | 142,8 | 9,2 | 296,5 | 7,8 |
| Available  seat kilometres mill | 1 274,6 | 7,9 | 2 680,2 | 5,3 |
| Revenue  passenger kilometres mill | 1 083,5 | 10,5 | 2 247,1 | 9,0 |
| Passenger  load factor % | 85,0 | 2,0 p | 83,8 | 2,8 p |
| Domestic | ||||
| Passengers  1000 | 209,1 | 27,9 | 378,7 | 27,0 |
| Available  seat kilometres mill | 157,9 | 19,8 | 290,5 | 23,4 |
| Revenue  passenger kilometres mill | 115,0 | 25,9 | 206,3 | 24,8 |
| Passenger  load factor % | 72,8 | 3,5 p | 71,0 | 0,8 p |
| Cargo Traffic | ||||
| Cargo  scheduled traffic total tonnes | 9 036,7 | 6,4 | 18 436,3 | 10,7 |
| Europe tonnes | 1 778,9 | 11,6 | 3 542,6 | 12,0 |
| North  Atlantic tonnes | 610,6 | -21,0 | 1 335,6 | -5,3 |
| Asia  tonnes | 6 488,8 | 8,3 | 13 246,7 | 12,1 |
| Domestic  tonnes | 158,5 | 17,0 | 311,4 | 15,5 |
| Cargo  flights, tonnes** | 1 513,0 | 16,9 | 2 855,6 | 15,4 |
| Cargo  tonnes total | 10 549,7 | 7,8 | 21 291,9 | 11,3 |
| Available  tonne kilometres* mill | 113,2 | 10,5 | 233,8 | 6,2 |
| Revenue  tonne kilometres mill | 63,2 | 8,1 | 128,0 | 12,6 |
| Available  sched.cargo tonne kms*, mill. | 105,8 | 11,4 | 218,5 | 6,9 |
| Revenue  sched.cargo tonne kms, mill. | 55,6 | 6,3 | 113,4 | 11,0 |
| Cargo load  factor* % | 55,8 | -1,3 p | 54,8 | 3,1 p |
| – Â North-Atlantic cargo load factor* % | 40,4 | -4,7 p | 40,7 | 1,2 p |
| – Asia  cargo load factor* % | 56,2 | -2,4 p | 55,5 | 2,5 p |
| Scheduled traffic Cargo load factor*, % | 52,5 | -2,5 p | 51,9 | 1,9 p |
* Operational calculatory capacity
** Including purchased traffic
— Change %: Change compared to the figures of the respective periods in the previous year (p = percentage points)
— Available seat kilometres, ASK: Total number of seats available, multiplied by the number of kilometres flown
— Revenue passenger kilometres, RPK: Number of revenue passengers carried, multiplied by kilometres flown
— Passenger load factor: Share of revenue passenger kilometres of available seat kilometres
— Available tonne kilometres, ATK: Number of tonnes of capacity for carriage of passengers, cargo and mail, multiplied by kilometres flown
— Revenue tonne kilometres, RTK: Total revenue load consisting of passengers, cargo and mail, multiplied by kilometres flown
— Overall load factor: Share of revenue tonne kilometres of available tonne kilometres for carriage of passengers, cargo and mail